


Macro & Markets Update: Q2 2026
The first half of 2026 has been another powerful reminder of the resilience of markets. After a challenging first quarter marked by geopolitical conflict, higher oil prices, and an equity market drawdown, risk assets rebounded meaningfully in the second quarter as the economy remained on solid footing, earnings proved stronger than expected, and several of the most acute macro concerns moderated.
Global equities rose +15% in Q2 after declining -3% in Q1, bringing year-to-date returns through June to over +11%. The magnitude of the reversal was notable: Q1 represented one of the weaker starts to a year over the past half century, while Q2 marked one of the stronger recoveries over that same period. Other major asset classes also delivered constructive results year-to-date through June, including commodities, which rallied +14%, while high-quality bonds posted more modest returns, with the Bloomberg U.S. Aggregate Index up +0.6%.
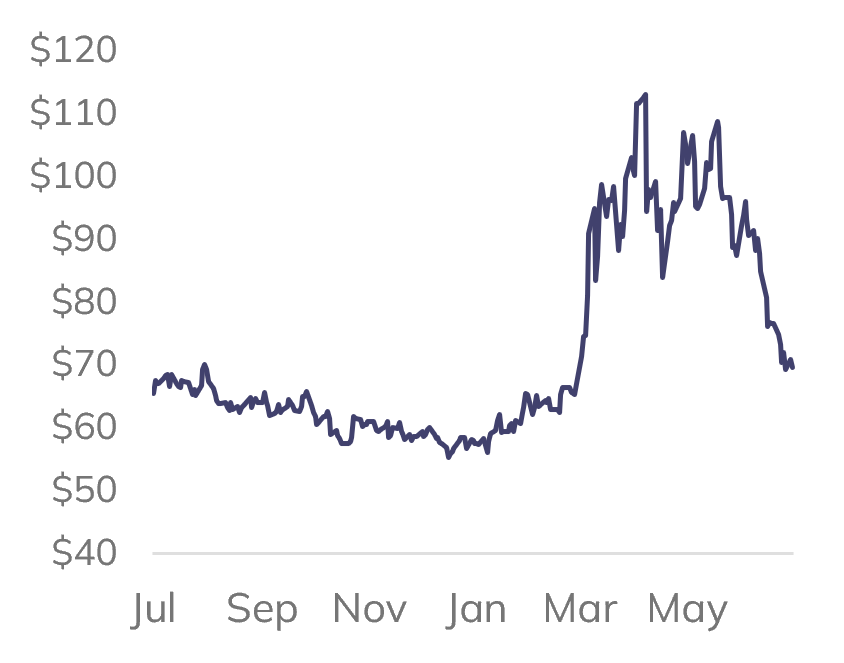
In many ways, this is another example of markets climbing a wall of worry — advancing not because the backdrop was free of risk, but because the most concerning downside scenarios did not materialize. One important example has been the energy shock tied to Iran. While the conflict remains fluid, energy transit through the Strait of Hormuz has improved, and reports of progress toward a broader U.S.-Iran framework have reduced the risk that the situation evolves into an even more disruptive global event. Oil prices also moved back lower in June, suggesting investors have become more confident that the conflict is unlikely to result in a sustained impairment of global energy supply.
The performance pattern so far this year reinforces two important principles for investors. The first is about market timing. The sharp contrast between Q1 and Q2 reinforces one of our core investment views: time in the market is generally better spent than timing the market. Investors who reduced exposure during the first-quarter drawdown would have needed to re-enter quickly to participate in the recovery – something that is extremely difficult to do consistently. For clients who stayed invested through the volatility, patience was rewarded.
The second is about diversification. After years in which U.S. equities dominated global market leadership, many allocators questioned whether they should own anything else. Similar to what we saw in 2025, this year has shown again that leadership changes, and a thoughtful global allocation remains the best way to capture those rotations. Year-to-date through June, international equities returned +14% versus +10% for U.S. equities.
That same diversification point extends beyond equities. Following a weak decade in the pre-COVID years, commodities have been among the stronger performers so far in 2026, particularly as inflation risk, energy constraints, and supply-demand imbalances re-emerged as important market drivers. It is a useful illustration of why asset classes that feel less relevant in one period can become much more relevant in the next.
Fixed income also continues to have a role in portfolios. While returns have been more muted year-to-date, the current yield remains much more attractive than it was for much of the last decade. With investment-grade bond yields hovering around 5%, the forward-looking return potential remains compelling — on both an absolute basis, and relative to cash, where yields are closer to 3.5% today.1 The higher yield from high-quality fixed income has already mattered: over the last two years, investment-grade bonds have delivered a 5% annualized return, highlighting their ability to contribute to total portfolio returns.
The strong recovery does not mean that risks have disappeared, but it does provide an important backdrop for the rest of this letter. Investor sentiment has improved, risk appetite has broadened, and capital markets are beginning to reopen in more visible ways. U.S. IPO proceeds are expected to reach roughly $160 billion this year2, helped by the SpaceX IPO and a broader resurgence in high-profile issuance — an important development for investors with private investment exposure, as healthier public markets can improve liquidity, valuation discovery, and exit opportunities for transformational companies. The sections that follow examine the key drivers behind the recovery, including growth, earnings, valuations, AI, and the evolving policy backdrop.
Select Market Indices
As of June 30, 20263
| Q2 | YTD | 1 Year | 5 Year | |
|---|---|---|---|---|
| U.S. Bonds | 0.7% | 0.6% | 3.8% | 0.1% |
| Global Equities | 14.9% | 11.2% | 23.7% | 11.0% |
| U.S. Equities | 15.2% | 10.2% | 22.3% | 13.4% |
| International Equities | 14.5% | 13.7% | 27.7% | 8.8% |
| Commodities | -8.1% | 14.4% | 25.5% | 9.4% |
Growth & Earnings: Helping Markets Look Through the Noise
The key reason equity markets have recovered so strongly from the Q1 sell-off is that the geopolitical and energy shock has not translated into a material deterioration in economic growth, corporate earnings, or profit margins. The economic and corporate backdrop has held up better than expected, and with oil prices having retraced back to pre-conflict levels by the end of June, an important source of inflationary pressure has moderated for now.
Economic Growth Remains Resilient
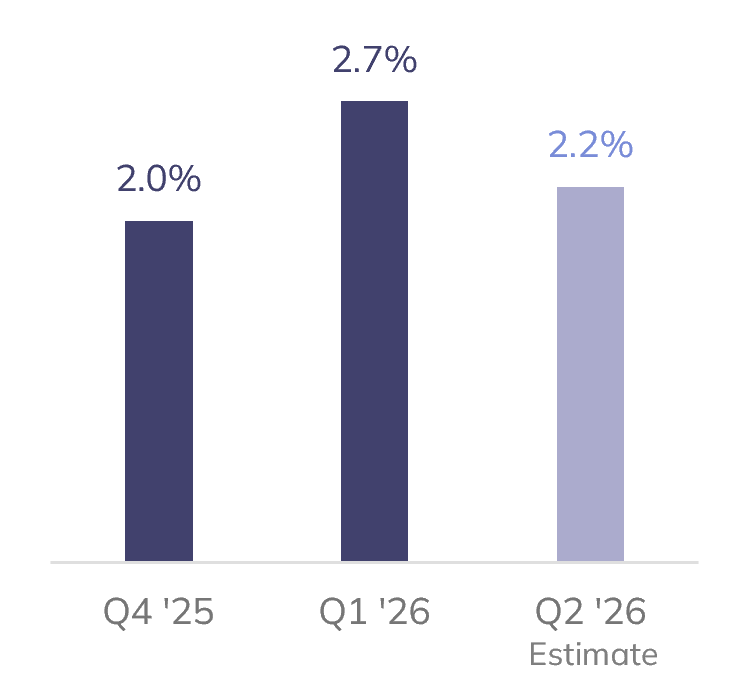
The U.S. economy continues to expand at a healthy pace. Real GDP rose +2.7% year-over-year in Q1 and is expected to have grown by roughly +2.2% in Q2. Consumer spending has remained strong, business investment has been supported by the AI-related capex cycle, and the labor market has remained resilient, with unemployment at 4.2%. While there are pockets of stress beneath the surface, particularly among lower-income households and more highly levered businesses, the broader economy remains in reasonably good shape.
Policy and AI Capex Provide Support
Several offsetting policy tailwinds have also helped. Lower tariffs following the Supreme Court ruling against the IEEPA tariffs, along with individual and corporate tax cuts from the One Big Beautiful Bill Act, are expected to provide a boost equal to around 1% of GDP in 2026. That support helped cushion the impact from higher energy prices earlier in the quarter. At the same time, the AI-related capital spending cycle remains an important support for corporate investment, earnings revisions, and the market segments most closely tied to AI infrastructure.
Corporate Profits Are Driving Market Performance
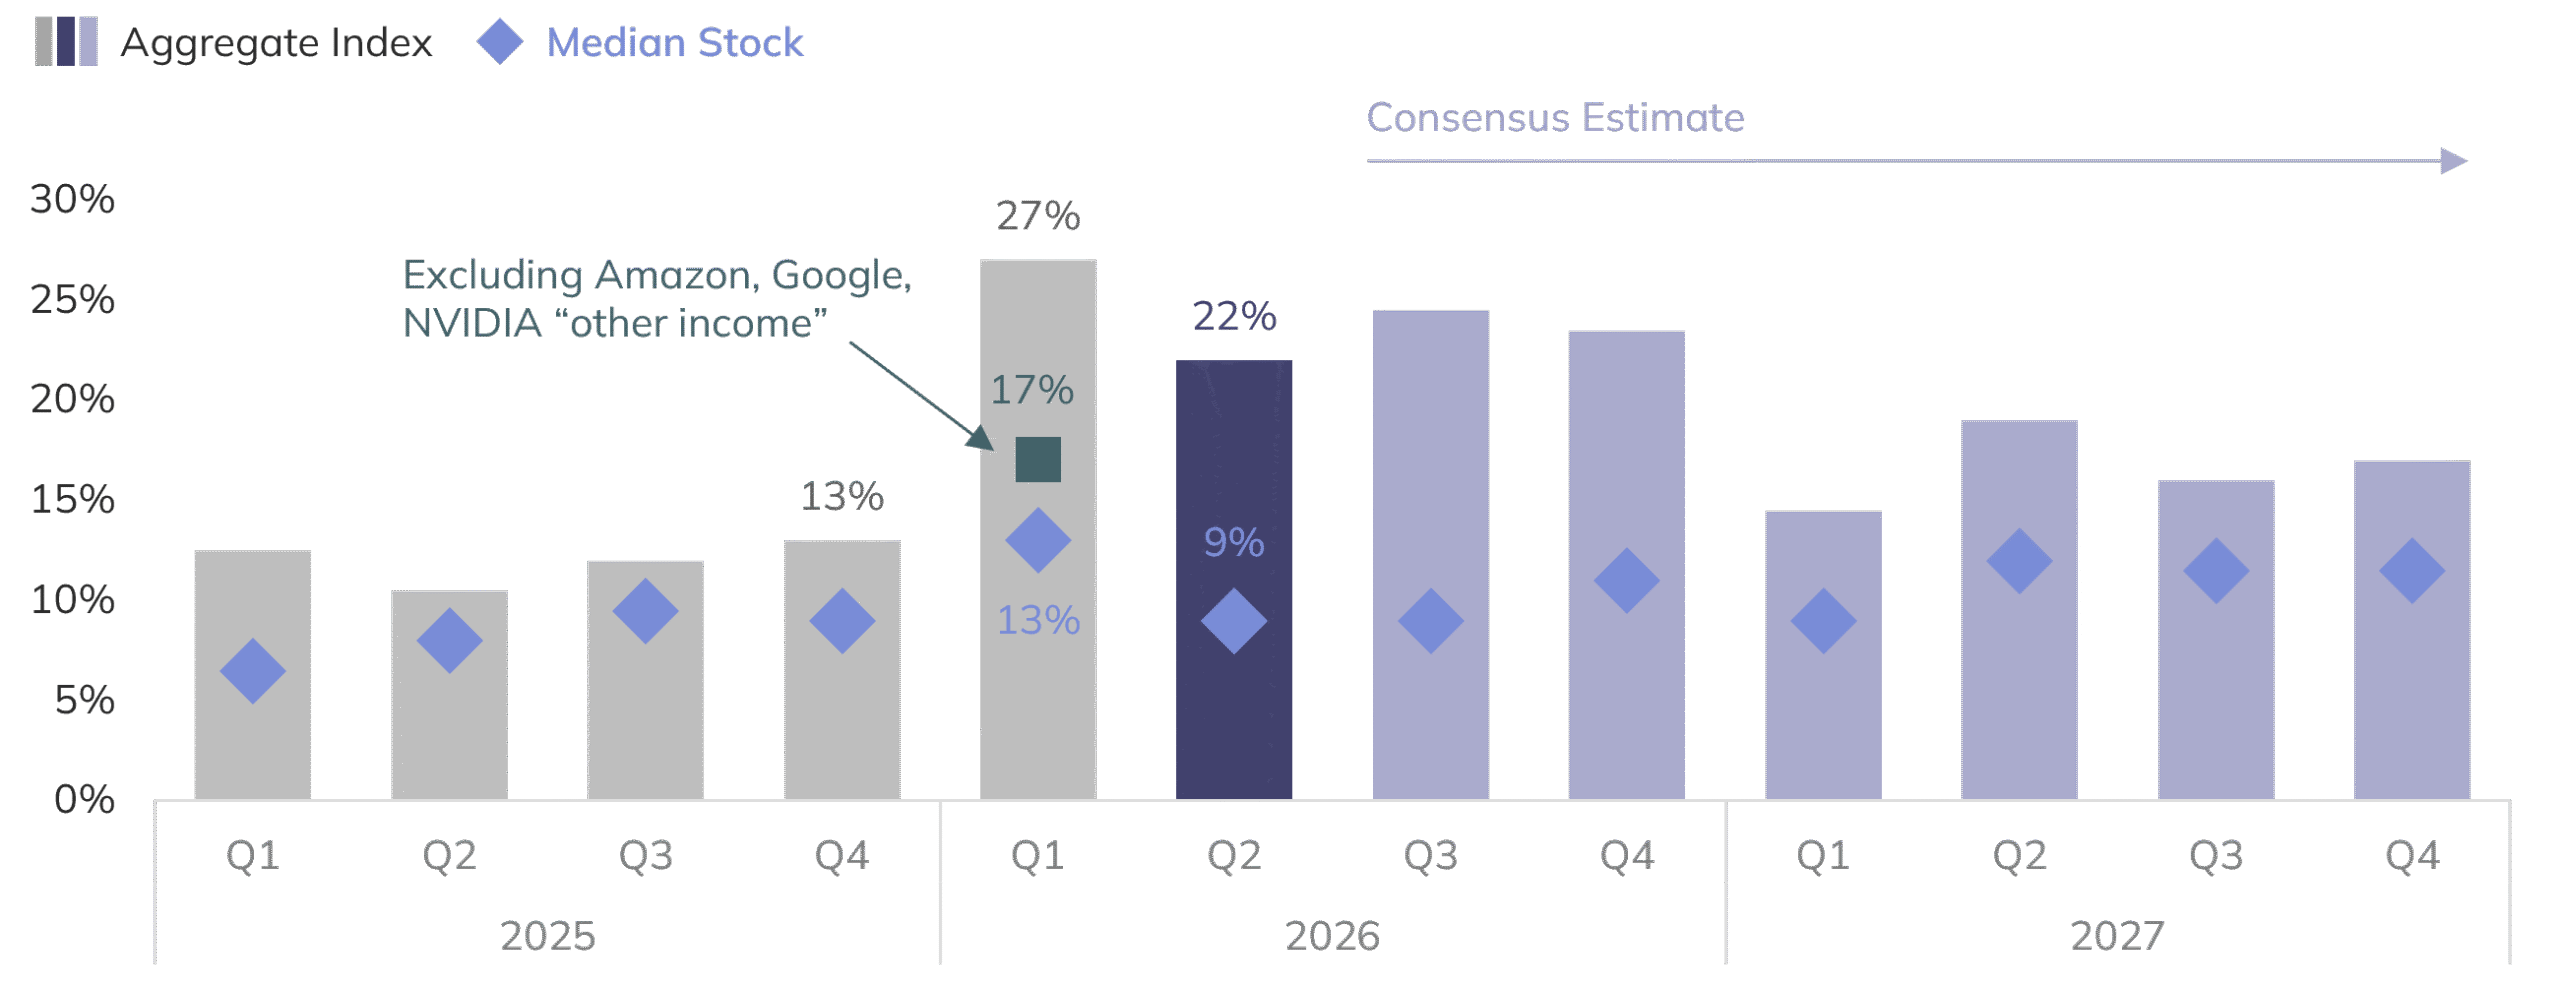
The equity market’s recent advance has been supported by higher earnings rather than multiple expansion, which is an important distinction. First quarter results were particularly strong: S&P 500 sales grew +12%, while earnings growth was nearly +30% – more than double the roughly +13% growth rate investors expected at the end of March.6 Technology and AI-related companies delivered outsized earnings growth, and the headline EPS number was flattered by mega-cap technology companies, including investment gains and mark-ups tied to stakes in leading private AI companies such as Anthropic and OpenAI. Even excluding those contributions, however, the median company still generated mid-teens earnings growth – an impressive result and an important source of support for the market.
Positive Economic Growth
U.S. Real GDP Growth YoY4
Oil Prices Moderating
WTI Oil prices5
S&P 500 Year-over-Year EPS Growth7
Fundamentals: Remain Strong, but Valuations Set a Higher Bar
Heading into Q2 earnings season, expectations remain high, with consensus looking for S&P 500 EPS growth of roughly +22% versus last year. The strength is meaningful, but also concentrated. A relatively small number of semiconductor, energy, and AI-related companies are expected to account for a large share of aggregate index earnings growth, with NVIDIA and Micron alone representing a meaningful portion of the total. This reflects strong end-demand and rising AI infrastructure budgets from the major hyperscalers, including Microsoft, Amazon, Alphabet, and Meta, with spending now expected to be around $750 billion this year (up from ~$400 billion in 2025).
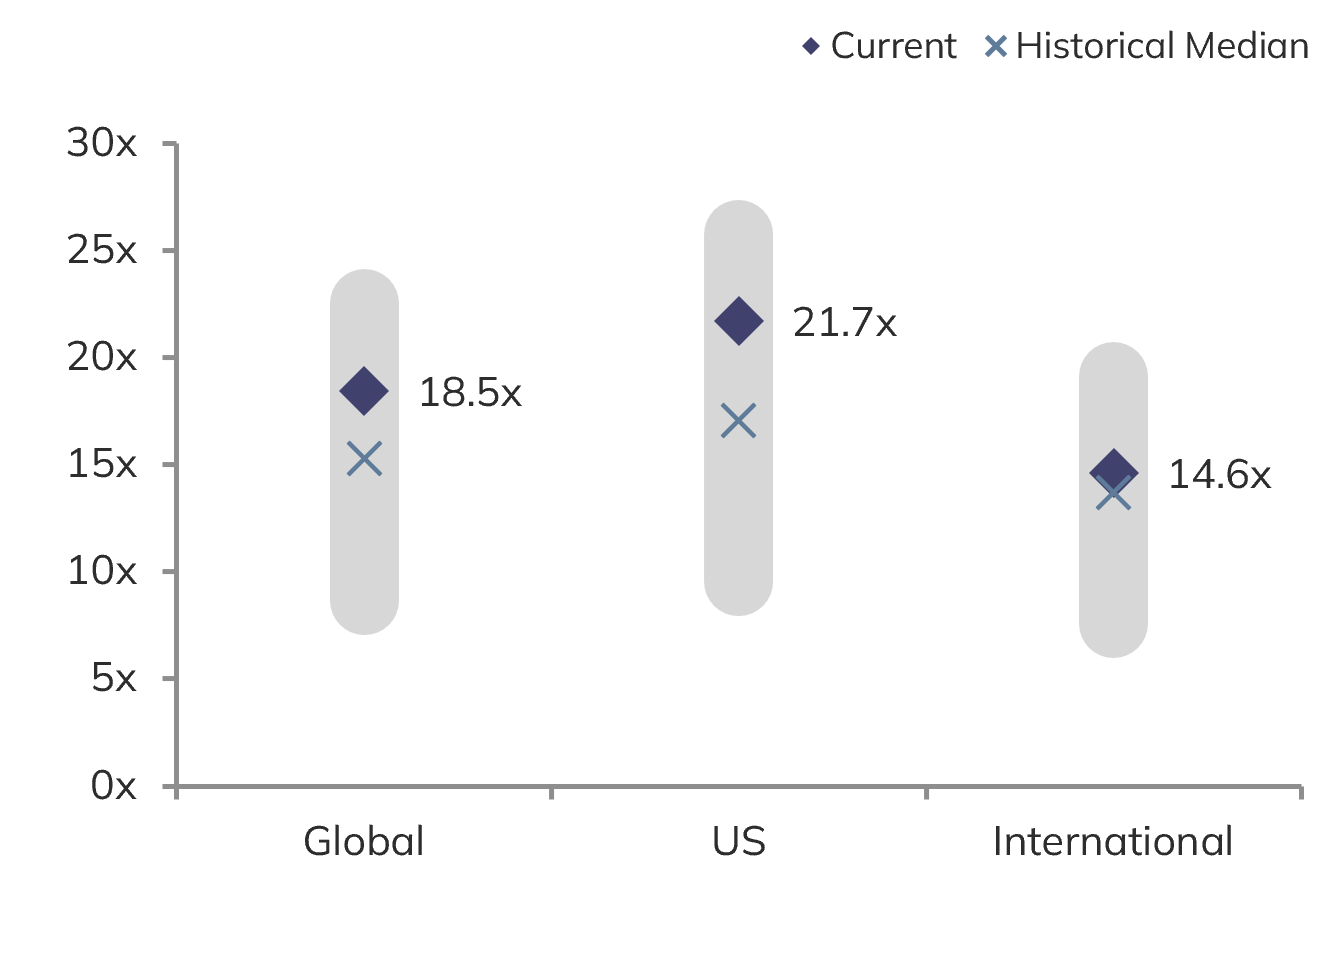
This earnings momentum is especially important because valuations are elevated. Global equities are trading around 18.5x forward earnings, while U.S. equities are trading around 22x – both above long-term averages. When valuations are already above average, future returns are less likely to come from investors paying significantly more for the same dollar of earnings. Instead, more of the burden needs to come from revenue growth, margin durability, and earnings expansion.
The good news is that fundamentals around the globe remain better than average. For example, in the U.S. (which accounts for about 65% of the global equity index):
- Profit margins are above historical medians at roughly 14% versus 11%.
- Balance sheets are healthy, with net debt / EBITDA around 1.6x versus a historical median closer to 1.7x.
- The earnings outlook remains favorable. Calendar year 2026 estimates call for growth of +25% in the U.S. (and +26% globally).
That backdrop can continue to support markets, but it also leaves less room for disappointment if earnings fall short, margins compress, or interest rates rise more than expected.
After equity markets compounded at roughly +20% per year over the last three years, we would expect returns to moderate from here, with earnings growth doing more of the heavy lifting than multiple expansion.
2026 Earnings Growth is Concentrated
Contribution by Company8
| Company | Sector | EPS Growth Contribution |
|---|---|---|
| NVIDIA Corp. | Tech | 18% |
| Micron Technology, Inc. | Tech | 16% |
| Alphabet Inc. | Comm Svcs | 6% |
| Broadcom Inc. | Tech | 5% |
| Exxon Mobil Corp. | Energy | 3% |
| Chevron Corp. | Energy | 3% |
| Microsoft Corp. | Tech | 3% |
| Apple Inc. | Tech | 2% |
| Marathon Petroleum Corp. | Energy | 1% |
| Valero Energy Corp. | Energy | 1% |
| Top 10 contributors AI infrastructure blocks | 58% 50% |
Valuations
Price to forward earnings9
Margins & Leverage
Current versus Historical Median10
| Profit Margin | Net Debt / EBITDA | ||||
| Current | Hist. Median | Current | Hist. Median | ||
| Global | 13.0% | 8.8% | 1.9x | 2.6x | |
| US | 14.4% | 10.5% | 1.6x | 1.7x | |
| International | 11.5% | 8.0% | 2.2x | 3.3x | |
| Value | 11.7% | 8.9% | 2.4x | 2.9x | |
| Growth | 16.1% | 9.0% | 0.8x | 1.4x | |
| Large | 14.4% | 9.6% | 1.8x | 2.0x | |
| SMID | 7.5% | 5.9% | 2.8x | 3.1x | |
Note: Margins are above historical medians, with some of the improvement reflecting a change in index composition rather than simply a cyclical peak. For example, technology represents a larger share of the market today, and many of the largest companies have higher-margin revenue streams and meaningful scale advantages. That may support higher through-cycle profitability than history would suggest, even as AI-related capital intensity bears watching.
Technology Has Become a Large Part of the U.S. Equity Market
While Concentration Has Risen, Fundamentals Offer More Support Than in Prior Cycles
One question that comes up frequently is whether technology has become too large a share of the U.S. equity market. The answer is that technology concentration is real, and it does increase risk – but it is also more fundamentally supported than it was during prior episodes of market excess.
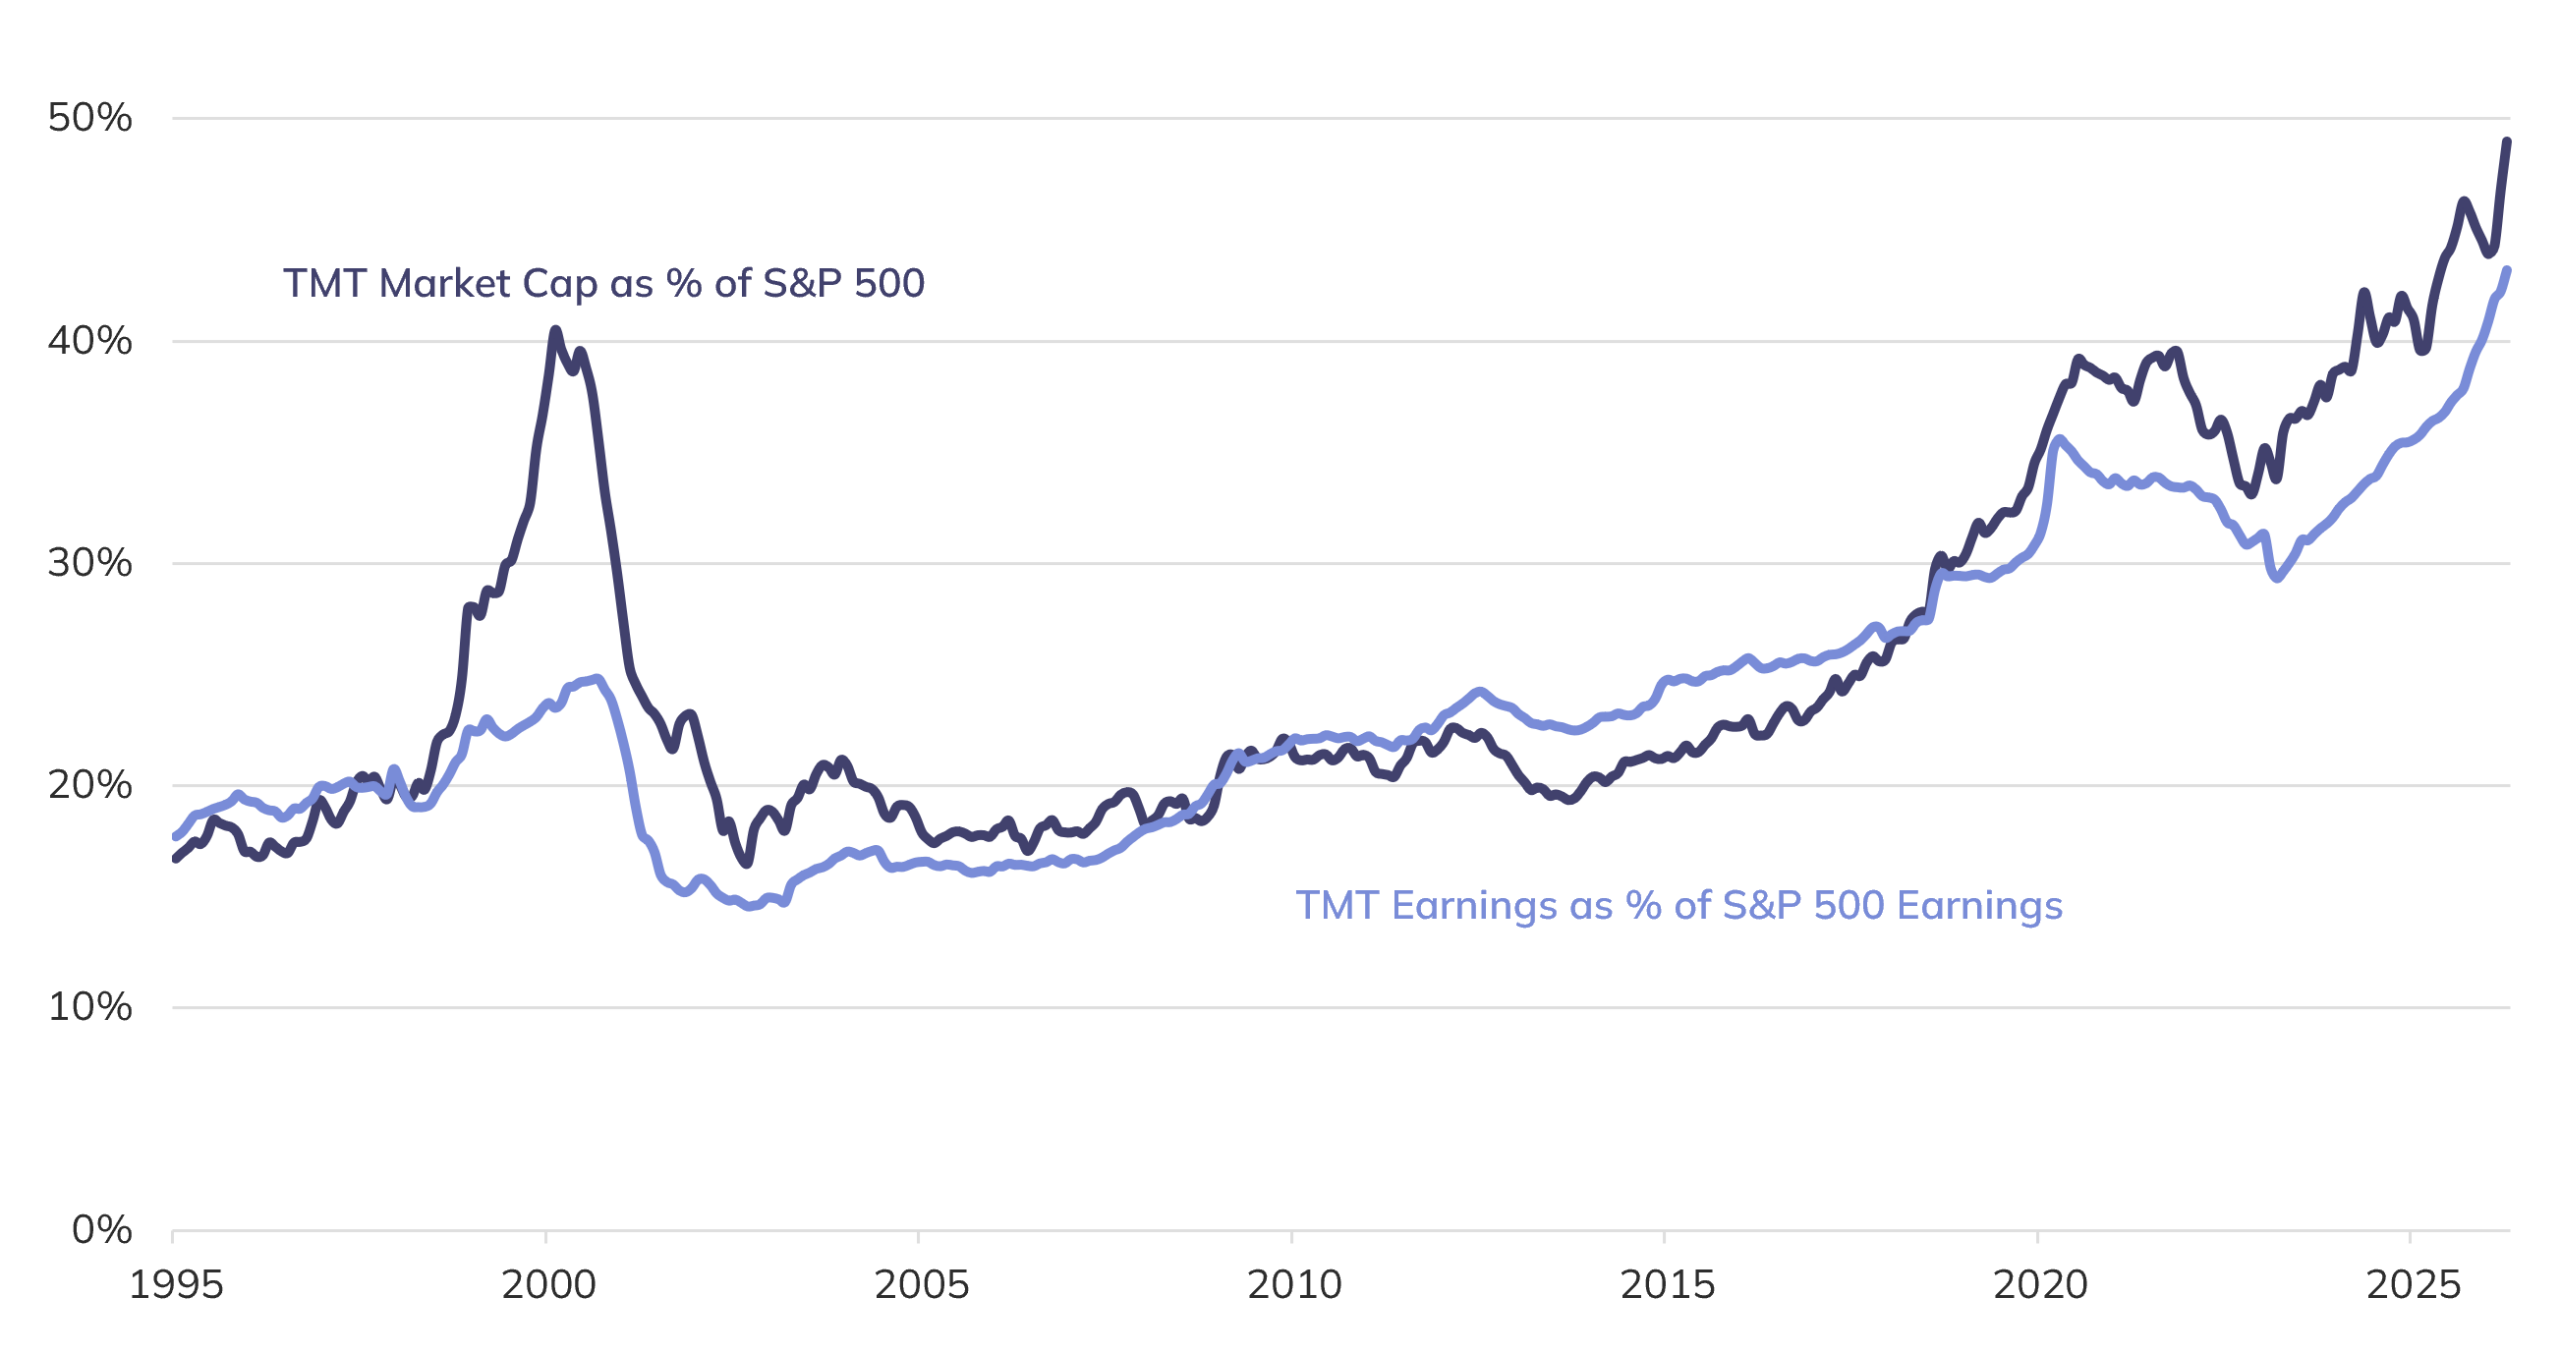
Technology, media, and telecom (“TMT”) now represents approximately 45% of the S&P 500, and the top 10 companies represent approximately 40% of the index. That level of concentration means that if the largest companies disappoint – whether because growth falls short, margins compress, capital spending weakens, or valuations reset – the impact on index returns could be significant.
The important distinction is that technology’s share of earnings has also grown. TMT’s share of market capitalization and earnings contribution are both around 40% today. That is meaningfully different from the late-1990s technology bubble, when TMT represented roughly 40% of market capitalization but less than 25% of earnings.
In the late 1990s, investors were often paying extreme valuations for companies with limited earnings support. Today’s largest technology companies are producing substantial profits, generating significant cash flow, and funding much of their growth through internal resources. There has been some recent evidence of rising debt and equity issuance to fund AI infrastructure, but we are still in the relatively early innings.
The conclusion is not that concentration risk should be ignored. It should not. That is part of the reason we allocate capital to areas adjacent to TMT, including small-cap and value-oriented exposures, which can help reduce reliance on the largest index constituents. At the same time, we would not recommend dismissing TMT companies simply because they have become a larger part of the market. Their rise in index weight has been supported by fundamentals, and investors have been well served by having meaningful exposure to this part of the market.
U.S. Equity Market Sector Exposures
Technology’s Market Weight Has Risen — But Earnings Support Has Also Improved11
We feel it is important to distinguish between concentration supported by earnings and concentration driven primarily by speculation. Today’s market is not without risk, but it is not broadly disconnected from fundamentals as observed in the late 1990s. During the Tech Bubble, the difference between TMT’s share of market cap and earnings in the S&P 500 peaked at 17%; today it’s 6%.
Artificial Intelligence: A Large, Fast-Moving Opportunity
Artificial intelligence remains one of the more compelling reasons to be optimistic about the long-term outlook for productivity, innovation, and market leadership. What makes this moment unusual is not just the promise of the technology, but the size of the economic opportunity and the speed at which the technology is improving.
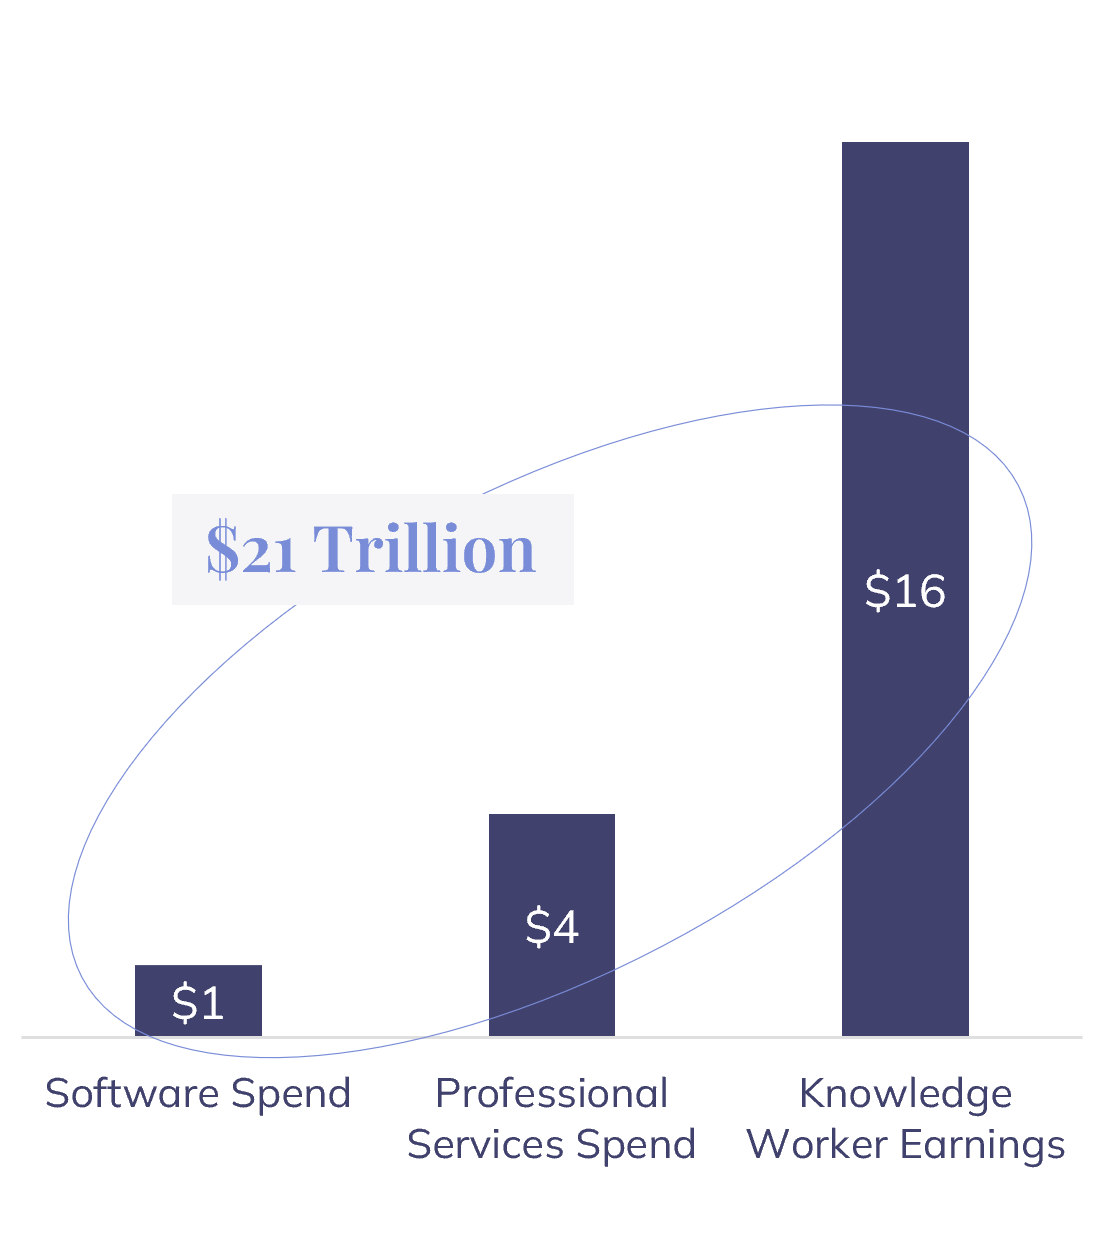
To frame the market opportunity, we look beyond software spending alone and include professional services spend and knowledge worker earnings. Together, those categories represent a roughly $21 trillion global “intelligence market,” compared with approximately $1 trillion of annual software spend. While only a portion of that market is addressable today, the scale helps explain why capital is moving so aggressively into AI and why the theme has become such an important driver of corporate investment, earnings growth, and private market value creation.
The pace of improvement has also been remarkable. AI models are becoming more capable of completing longer and more complex tasks, while usage costs continue to decline. For example, GPT-4o was introduced with input pricing of roughly $5 per million tokens, while GPT-4o mini was later introduced at $0.15 per million input tokens – a roughly 97% lower price point within the same model family. While not a pure same-model price decline, it illustrates an important point: AI capability is improving while lower-cost models are expanding the range of economically viable use cases. That combination helps explain why adoption is moving beyond technology companies into finance, manufacturing, retail, healthcare, construction, and other sectors.
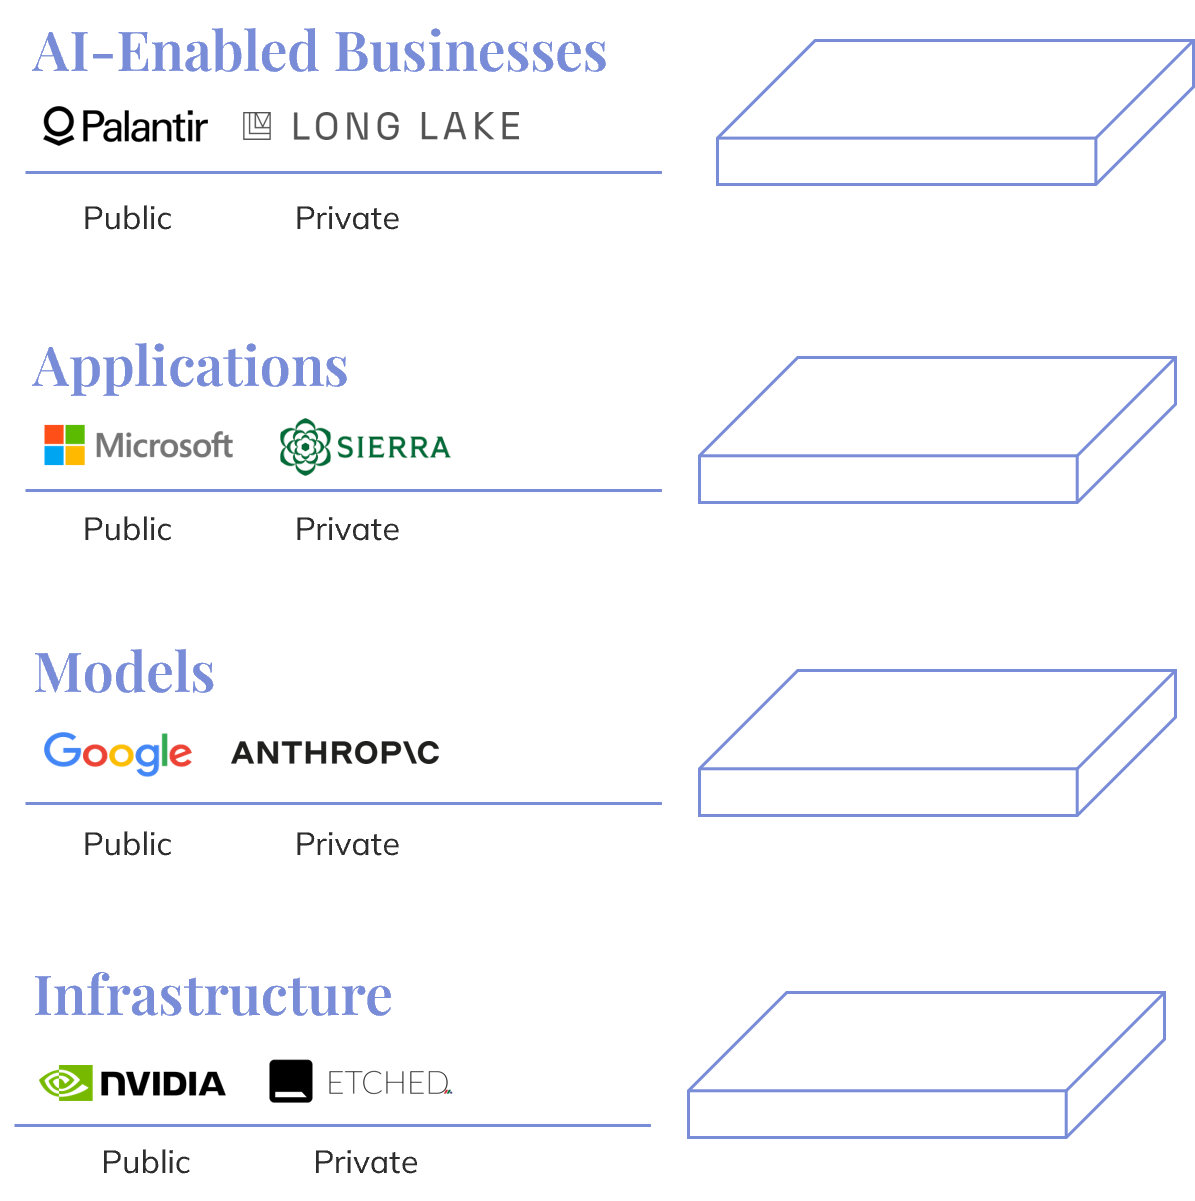
From an investment perspective, AI should not be viewed as a single trade or a narrow group of stocks. It is an ecosystem spanning infrastructure — including chips, data centers, power, and energy — as well as frontier models, workflow applications, and AI-enabled businesses. Some of today’s most visible winners are in semiconductors and infrastructure, where demand is immediate and measurable. Over time, more value may also accrue to application-layer companies that own critical workflows, model companies that achieve durable scale, and businesses that use AI to structurally improve margins or deliver services more efficiently.
That breadth is why we believe the opportunity spans both public and private markets. The objective is not simply to “own AI,” but to build diversified exposure across the ecosystem while remaining disciplined about where value is likely to accrue. The opportunity will not be linear, and not every AI-related investment will work. The key questions are becoming more specific: how token pricing evolves, whether enterprises generate measurable returns on AI spending, which companies can defend their economics as models improve, and how value is ultimately shared across infrastructure providers, model companies, applications, and end users. AI may be one of the most important forces shaping markets over the next decade, but capturing that opportunity will require selectivity, diversification, and discipline.
AI’s Addressable Market
Estimate based on size of the market for intelligence12
Investing in the Layers of AI
Representative companies shown
Examples shown are for illustrative purposes only and are not intended to reflect any investment program or portfolio.
The Federal Reserve: More Credible, But Less Predictable?
The Federal Reserve remains an important part of the outlook, but the story is more nuanced than simply viewing the Fed as a risk. In some respects, the policy backdrop may be improving. Chair Warsh appears intent on reinforcing the Fed’s inflation-fighting credibility by placing greater emphasis on price stability and less emphasis on pre-committing to a specific path for interest rates. A central bank that is viewed as serious about inflation can help anchor longer-term inflation expectations, support the dollar, and reduce the risk that more aggressive policy action is required later.
The tradeoff is that the near-term policy path may be less predictable than investors became accustomed to in recent years. Under prior Fed leadership, markets often relied heavily on forward guidance — explicit signals from policymakers about the likely path of future rate cuts or hikes. Chair Warsh has suggested a preference for giving the Fed more flexibility, which means markets may receive fewer clear signposts about how policy is likely to evolve. In that environment, each inflation report, employment release, and Fed communication may carry more weight.
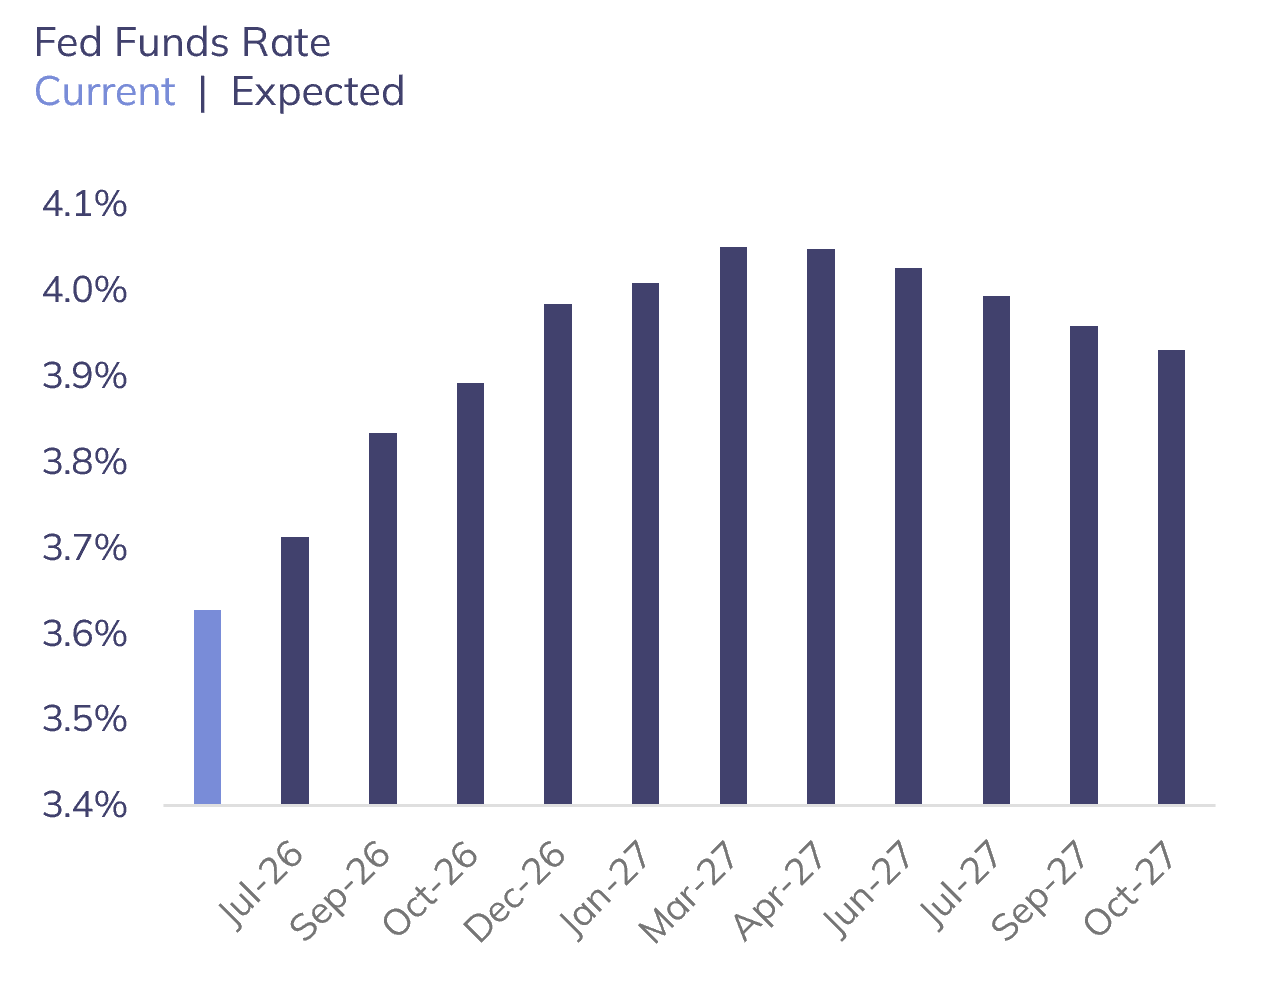
That shift is already visible in market pricing. The June FOMC meeting pushed investors to price a tighter near-term rate path, even though longer-run expectations moved much less. Stronger payrolls or hotter inflation data could quickly revive expectations for additional hikes, while softer inflation data could ease those concerns.
The challenge is that inflation remains above target. Lower oil prices help, but they do not by themselves prove that inflation has fully normalized. Underlying inflation remains too high, particularly in services, and other cost pressures — including tariffs, supply-chain frictions, and AI-related hardware demand — are still present. A Fed focused on rebuilding credibility is less likely to look through those pressures simply because growth remains positive or risk assets become volatile.
This represents an important shift in the Fed’s reaction function. For much of the post-pandemic period, markets viewed the Fed as a source of insurance: if growth weakened, the Fed would ease; if risk assets came under pressure, the Fed would validate easier financial conditions; and if inflation was driven by supply or energy shocks, officials would often look through it. The current Fed appears to be signaling something different: while inflation remains above target, policy is likely to remain more constrained.
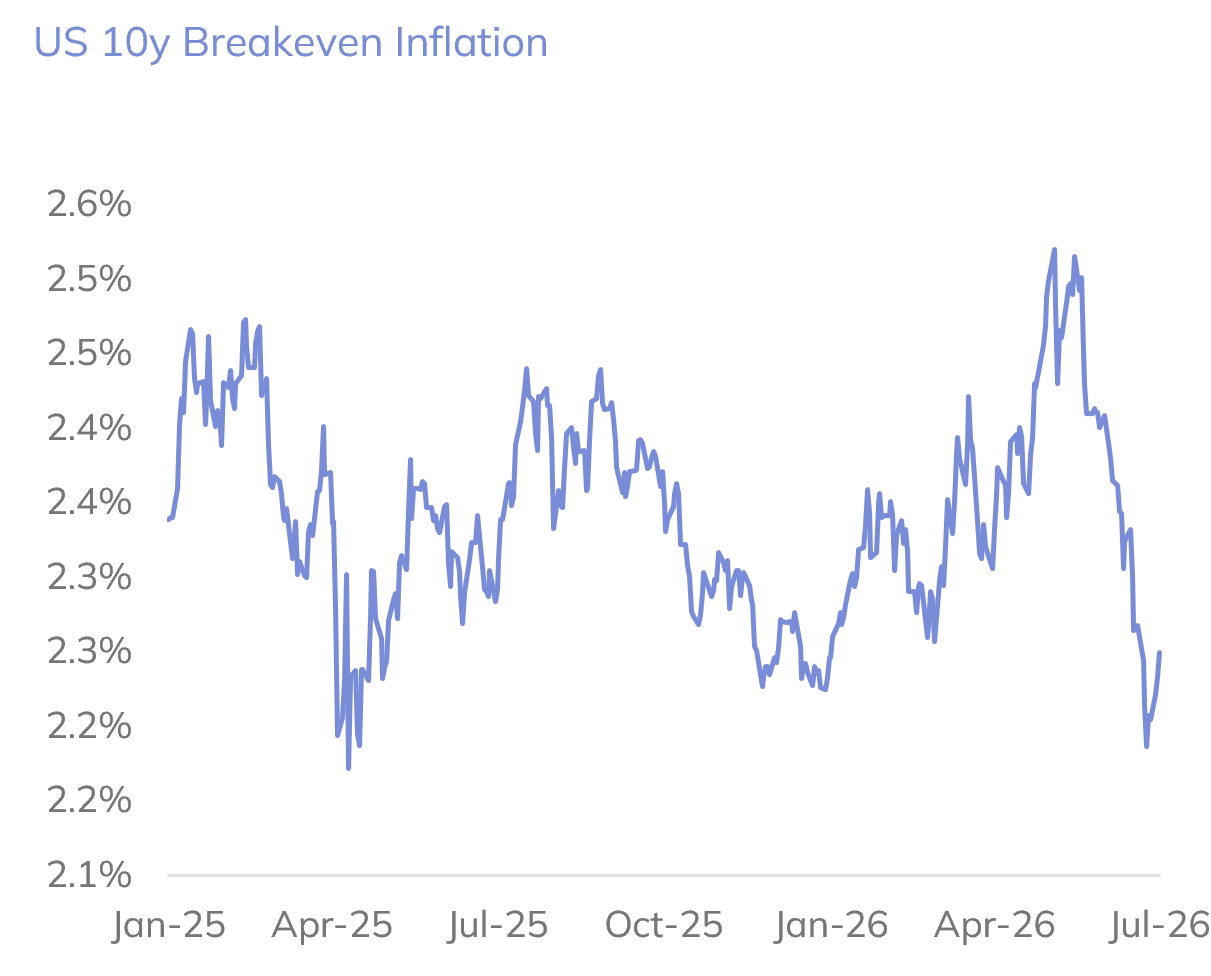
That does not mean the Fed needs to hike aggressively from here. If oil prices continue to decline and inflation data improves, the case for additional tightening should become less compelling. Market-based inflation expectations have also moved in a reassuring direction, with 10-year breakeven inflation declining and the yield curve flattening. That distinction matters: current inflation remains too high, but longer-term expectations suggest investors believe a more credible Fed can keep inflation from becoming entrenched.
For investors, the implication is that Fed credibility may be a long-term positive, but the path could be choppier. Markets may need to become more comfortable with a central bank that provides less guidance and is less willing to respond quickly to market volatility while inflation remains above target. That could create more short-term volatility around inflation data, employment reports, and Fed communication, but a more credible central bank with better-anchored inflation expectations is not necessarily a negative for long-term investors.
Markets Now Expect a Tighter Policy Path
Investors went from pricing in 2.5 cuts in ’26, to 1 hike today13
Inflation Expectations Near Fed Target
Long-term inflation expectations are well-anchored14
Concluding Thoughts: Constructive, But Expect a Higher Bar
The first half of 2026 reinforced an important lesson: markets can recover quickly when the underlying economic and earnings foundation remains intact. Despite geopolitical conflict, energy volatility, elevated valuations, and shifting expectations for Fed policy, growth remained positive, corporate earnings surprised to the upside, and risk assets delivered strong returns.
That leaves us constructive, but not complacent. The economy remains on solid footing, corporate margins and balance sheets are healthy, and the AI investment cycle continues to support spending, earnings growth, and innovation across both public and private markets. At the same time, valuations are above long-term averages, market leadership remains concentrated, and the Fed may be less willing to provide the kind of policy support investors became accustomed to in prior cycles. In other words, the backdrop is supportive — but the margin for error is narrower.
For portfolios, this does not argue for market timing. If anything, the sharp reversal from Q1 to Q2 is another reminder of how difficult it is to step out of markets and re-enter at the right time. It does, however, argue for disciplined portfolio construction: remaining invested, diversified across multiple sources of return, and selective about where capital is deployed.
We remain optimistic about the long-term opportunity set, particularly given the durability of the economy, the strength of corporate earnings, and the transformative potential of AI. But the next phase of returns is likely to be driven less by broad multiple expansion and more by the principles that have always mattered most: discipline, multi-asset class diversification, and a long-term perspective.
Endnotes
1 Investment-grade bond yields represented by Bloomberg US Aggregate Bond Index. Cash yield represented by Fidelity Money Market Treasury Only Fund (FSIXX).
2 Goldman Sachs base-case forecast for 2026 U.S. IPO proceeds, as reported by Reuters, February 9, 2026.
3 Data as of June 2026. Index returns over a year are annualized. Indices used in the table are as follows: US Bonds = Bloomberg US Aggregate Bond Index, Global Equities = MSCI All Country World Index, US Equities = S&P 500, International Equities = MSCI All Country World Index ex US, Commodities = Bloomberg Commodity Index.
4 Real GDP data sourced from FRED. Consensus Q2 estimated sourced from Bloomberg.
5 WTI oil price sourced from Bloomberg.
6 S&P 500 earnings data sourced from FactSet Earnings Insight.
7, 8 S&P 500 year-over-year EPS growth and contribution to earnings growth from Goldman Sachs.
9, 10 Valuation, Margins, and Earnings Growth data is sourced from Bloomberg as of 5/31/2026. Earnings growth for 2026 and price to forward earnings are based on consensus sell-side estimates. Valuation, Profit Margin, and Leverage range reflects data over the previous 20 years. Global: MSCI ACWI Index; US: MSCI USA Index; International: MSCI ACWI ex US Index; Value: MSCI ACWI Value Index; Growth: MSCI ACWI Growth Index; Large: MSCI ACWI Large Cap Index; SMID: MSCI ACWI SMID Cap Index.
11 S&P 500 TMT exposure represents the sum of S&P 500 Communication Services and Technology sectors market cap/earnings, data is sourced from Yardeni Research.
12 World Bank, International Labour Organization, Gartner.
13 Sourced from Bloomberg as of June 30, 2026.
14 Sourced from Bloomberg as of June 30, 2026.