

With federal debt above $40 trillion and deficits near 6% of GDP at a time when the economy is at full employment, clients often ask us where things break. It is the right question, and the honest answer is that the direction of travel is not sustainable. The Congressional Budget Office projects a $1.9 trillion deficit for fiscal 2026, debt held by the public reaching 120% of GDP by 2036, and net interest costs roughly doubling from about $1 trillion to $2.1 trillion over that period. This needs to be addressed, but a long-term problem is different from an imminent crisis.
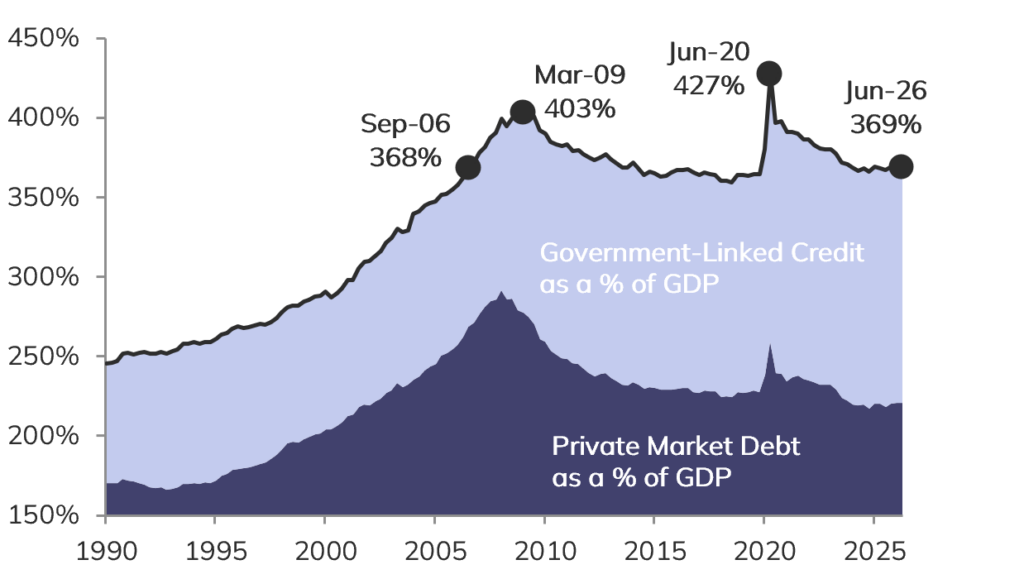
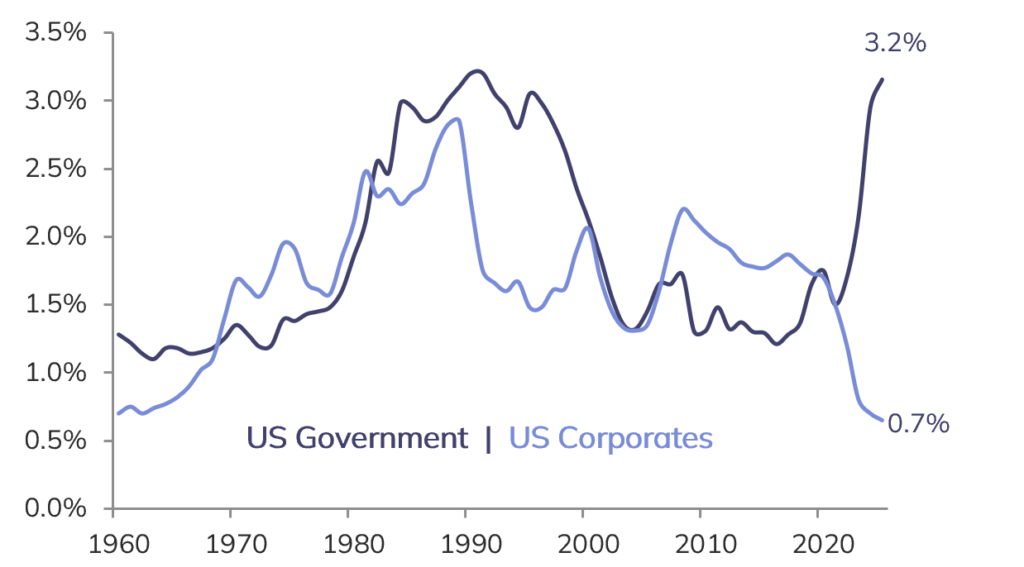
Part of the answer lies in looking beyond the government to the rest of the economy. US federal debt took more than two centuries to reach $20 trillion and has roughly doubled in the past decade. Private borrowers have moved the other way. Measured against the size of the economy, household debt has fallen below both its pre-pandemic level and its level in 2000, and corporate debt is also lower than before the pandemic despite heavy AI investment. Household finances look even stronger given that many mortgages were locked in at low rates and household assets sit at record highs. Corporate interest payments have fallen to about 0.7% of GDP, among the lowest levels in decades. Combined, government and private-sector debt stands at about 370% of GDP, below the 403% level reached in 2009 and 427% in 2020.
Strong private balance sheets are a key reason higher rates and energy prices have done less damage to consumers and businesses this year than many expected.
It also helps to be specific about what “breaking” would actually look like. A sudden market accident, like the 2023 regional bank failures, is notoriously hard to forecast. Those events typically occur when leverage, mismatched assets and liabilities, and a sudden need for liquidity collide – and the level of rates is rarely the sole cause. The government being unable to pay its interest bills is a different matter. Federal interest payments have risen to about 3.2% of GDP, roughly back to their early-1990s highs, and they compete with Social Security, Medicare, defense, and other priorities for the same dollars. Still, the government collected about $5 trillion of revenue last year against a little over $1 trillion of net interest, so a missed payment would reflect a political choice, such as a debt-ceiling standoff, rather than a lack of resources. Importantly, not all federal debt affects the deficit in the same way. Of the more than $40 trillion outstanding, roughly $31 trillion is held by the public, including investors, banks, and foreign governments. The remainder is owed to government trust funds such as Social Security, so the interest on it is paid from one part of the government to another and does not directly add to the deficit. On the debt held by the public, each one-point increase in the government’s average borrowing cost eventually adds about $300 billion of annual interest. Even if the average cost doubled from about 3.5% today to 7%, interest on today’s debt would be roughly $2.2 trillion. That would be painful and force hard choices on taxes and spending, squeezing other priorities well before it threatened the government’s ability to pay.
The US also has advantages that some indebted borrowers do not. Treasury debt is issued in dollars, the world’s reserve currency, and the Federal Reserve can act as a backstop. That buffer is not free. Japan shows how heavy central bank support can shift pressure onto the currency and inflation. Still, borrowing in its own currency places the US in a different position from a borrower that owes money in someone else’s currency. Growth helps as well. With nominal GDP expanding at 5%-6%, the economy is, for now, growing faster than the average rate on existing debt, which slows the rise in the debt burden even as deficits continue to add to it.
None of this means the risk can be ignored, and there are signals we watch closely. If the 10-year yield moved above 6% without a matching acceleration in growth – alongside a weaker dollar, wider credit spreads, poor Treasury auction demand, and falling stock prices – we would become more concerned. That combination could indicate that borrowing costs are beginning to outpace nominal growth and that investors are demanding a larger risk premium to own US debt, which would make deficits harder to sustain. We are not seeing this risk today.
Total US Debt-to-GDP Below 2009 Levels
Government debt increased; private sector deleveraged1
Gov’t Interest Costs Rising; Corporate Costs Near Lows
Interest Payments as a Percent of Nominal GDP2
Endnotes
1 Source: Federal Reserve Z.1 Financial Accounts (FRED series FGTSL, ASUSGASL, DNSMSL, ASOMPL, ASCFBL, ASTLL), BEA nominal GDP (FRED: GDP). Governmentlinked = Treasuries, Agency & GSE-backed securities, Municipals. Private-market = Open market paper, Corporate & foreign bonds, Total loans. Adapted from Bianco Research.
2 Federal Reserve Bank of St. Louis FRED database, U.S. Office of Management and Budget, Board of Governors of the Federal Reserve System, and U.S. Bureau of Economic Analysis. Government interest payments are represented by Federal Outlays: Interest as Percent of Gross Domestic Product (FYOIGDA188S). Corporate interest payments are based on Nonfinancial Corporate Business; Net Interest and Miscellaneous Payments, Transactions (BOGZ1FA106130003Q), divided by nominal GDP and converted to an annual percentage. The underlying corporate series is reported quarterly at a seasonally adjusted annual rate and may differ from other measures of corporate interest expense.